The Sierra Club bills itself as the nation’s largest grassroots environmental organization. Sometimes, however, even grassroots support needs a jump start.
Such was the case in the latter half of 2016. Overall engagement for the San Francisco-based nonprofit was sagging. Donations had plateaued. Even pushes for electronic signatures on action petitions seemed to be progressing more slowly than before. After watching other nonprofits reap the benefits of increased activism in the wake of the November election, Sierra Club officials decided it was time to drive increased traction with constituents. So they turned to a familiar face: Cro Metrics.
Cro Metrics had been working with the organization for some time previously, poking and prodding the site with A/B tests to see how to find significant revenue wins. Finally, around late November and early December, those wins started coming in. The results were downright mind-boggling—triple-digit revenue growth, additional donations totaling hundreds of thousands of dollars, and a renewed commitment to engage supporters in bigger, bolder, and better ways.
According to Drew Seman, director of online fundraising for the Sierra Club, the month following this series of Cro Metrics tests was among the organization’s best month ever in terms of donations—a spike of nearly $5 million from the previous high.
“In general, we’re now raising two to three times as much money from one-time donations and five times as much from monthlies,” he said. “It’s safe to say nobody here expected those kinds of results.”
CHALLENGES
For Sierra Club, the push to evaluate the efficiency and effectiveness of donation forms actually started in October 2015. That was when the nonprofit moved from another customer relationship management platform to Salesforce. As part of this transition, the organization was forced to change up its donation forms and tweak them to work in the new platform. As Seman put it, none of the newly-formatted pages were tested at all.
“In some ways we were flying blind in terms of knowing if these changes were helping or hurting us,” he said, looking back. A subsequent switch to a new email system only compounded the problems.
Seman and his team knew they had to begin to address the situation, so they initially hired a testing vendor (not Cro Metrics). While this vendor managed to engineer some useful tests on basic page design, the vendor was painfully slow—pushing through one test per quarter. One form improvement per quarter simply is not enough to drive meaningful improvements. In the testing business, speed is everything.
By the time the Sierra Club came to Cro Metrics, nonprofit officials had some pretty serious expectations for meaningful results. They wanted faster test throughput: more tests being run every month. They wanted more variety of ideas for what to test. They wanted tests that could have lasting impact on the entire donation funnel. Finally, Seman and his colleagues wanted to get a sense of how much money they were leaving on the table—and they wanted to figure out how they could get more of that money into the organization’s coffers.
METHODOLOGY
Engineering A/B tests isn’t about drama and fanfare; instead, it’s about making changes either large or small to headlines, design, and click-through patterns, then monitoring how website users respond. The team from Cro Metrics did just this. They deployed a variety of A/B tests to see what sort of designs and messages garnered different responses from Sierra Club supporters. The Cro Metrics team conducted a broad range of tests—21 in all. Four in particular stood out:
- A test that gave donors the option to cover credit card processing fees
- Two tests that gauged donor interest in setting up recurring monthly gifts
- A test that addressed the benefits of inserting a survey or secondary ask into the middle of the giving process.
David Janczyn, product manager at Cro Metrics, said these tests were invaluable in proving to Sierra Club that simple tweaks can make a huge impact. “We helped them rethink the way they were asking people to get involved,” he said. “Along the way I’d say they learned the value of basing decisions more heavily on data.”
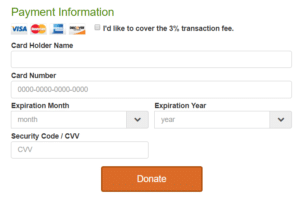
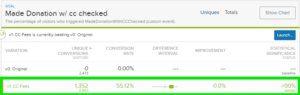
Giving donors the option to cover credit card processing fees
This particular test emphasized credit card fees—the 3 percent that credit card companies charge subscribers for using their services. The Cro Metrics team hypothesized that giving donors the option of opting in to pay these credit card fees would not hurt overall donations and would lead to an extra 3 percent in total donation value. To engineer the test, Cro Metrics added a button to the donation form and set up what’s known as a “painted door” test, meaning donors weren’t actually charged the additional 3 percent, but Cro Metrics kept track of how many donors were willing to do so. (The lightweight, painted door approach allows Cro Metrics to validate the impact of the change prior to any complex development work being required on the Sierra Club’s side). The company then linked to the test donation page from a specifically targeted email campaign.
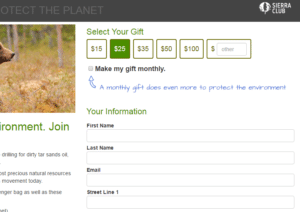
Gauging donor interest in setting up recurring monthly gifts
Two tests were aimed at increasing the number of Sierra Club donors who sign up to give recurring monthly donations at the time of their initial donation.
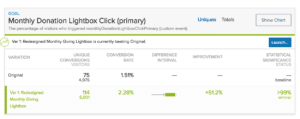
The first, SIERRA-15, revolved around variations of a “lightbox,” or a floating popup window. The original lightbox was heavy with text and hard to understand. As part of this test, the Cro Metrics team redesigned the box to have less text, clearer call-to-action buttons, and a more approachable graphic.

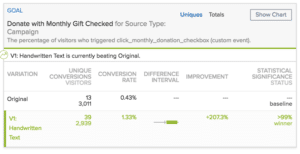
The second test, SIERRA-17, focused on additional donation page text in a handwritten font, and how this extra verbiage impacted click-throughs to becoming a monthly donor. Before the test, donation pages just offered options to give. As part of the test, Cro Metrics added handwritten text and an arrow pointing to the monthly donation check box.
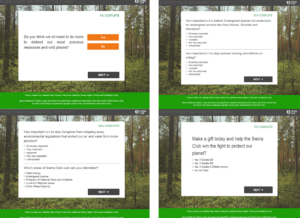
Assessing the benefits of inserting a survey or secondary ask within petition flow
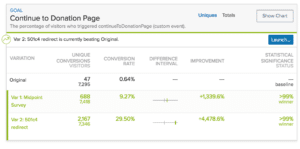
With this test, the Cro Metrics team ran an experiment that placed a survey at the end of The Sierra Club’s 501c3 petition process focused on increasing the number of petitioners who go on to make a donation. Non-profit law states that following a 501c3 petition, visitors must be presented with a ‘midpage ask’ (as it’s known) and voluntarily opt into donating before being directed to a donation page. Before the test, the standard ‘midpage ask’ was very simple: It comprised of some donation buttons and a call-to-action to share news about the petition on social media. To mix things up, the Cro Metrics team tried two variations: 1) A four-page survey that ended with an ask for donations, and 2) A 501c4 petition (which following a submission is allowed to direct straight to a donation form).
On a high level, the duration of all four of these tests varied. Janczyn said the minimum test length was seven days, but noted that tests can run anywhere from a week to a couple of months, and that the duration of a test usually depends on how much traffic the specific page gets and how many people are already converting there.
“If there’s a lot of traffic but nobody converts on a page, it still will take forever to measure any difference in the conversions,” he said. “You have an idea before you run a test of how long it might take, but there is always some uncertainty until you see how visitors actually interact with the new version.”
RESULTS
Across the board, results of the tests Cro Metrics conducted for Sierra Club were overwhelmingly positive.
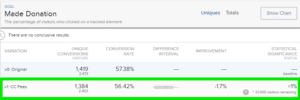
Giving donors the option to cover credit card processing fees
With this test, the key takeaway was that the vast majority of donors were willing to foot the bill for credit card processing fees. Out of 1,384 donations received, 1,352 (97 percent) of donors opted into paying the 3 percent transaction fee. Cro Metrics extrapolated this data to determine that the business impact of adding this button across all donations forms would return more than $150,000 additional yearly revenue.
Gauging donor interest in setting up recurring monthly gifts
Overall, both of the Cro Metrics tests aimed at increasing the number of monthly Sierra Club donors exceeded expectations.
For SIERRA-15, the redesigned lightbox resulted in a 51 percent lift in monthly donation button clicks, which translated into 39 additional conversions and an extra $20,000 in revenue.
For SIERRA-17, the data revealed that having handwritten text and an arrow pointing toward the monthly giving checkbox had a significant positive impact—a 207 percent increase in monthly donation conversions!
Both Janczyn and Seman said that overall monthly donations—and the number of monthly donors giving them—have more than doubled. Before the tests, Sierra Club had about $450,000 worth of monthly donations coming in every month; now the group pulls in more than $1 million. What’s more, Sierra Club went from 35,000 individual donors contributing monthly in November 2016 to more than 75,000 today. Seman is quick to note that more than 90 percent of that growth is online, and thus directly related to the improvements he and Cro Metrics identified by running these experiments.
Assessing the benefits of inserting a survey or secondary ask within donation flow
Results from this test were among the most surprising of the bunch. Amazingly, the first variation—the midpage survey—generated a 1,339 percent lift in visitors making a donation. The average amount was about $25. Still, the Cro Metrics team calculated that the test inspired 102 additional donation per month for a total of more than $2,500. The second variation was very successful as well, but those visitor did not convert to donate at high of a rate.. “Running multiple variations of a single broader hypothesis allows us to get more insights from each experiments,” notes Janczyn. “With this experiment, if we’d tested only the second variation, we would have identified it as a “win,” but we wouldn’t have found the better win that was the first variation. By testing both, we are able to see how they perform against each other as well as against the original.”
According to Janczyn, this last test was the most encouraging. In his mind, the success of the midpage survey seemed to suggest that donors were happy to share their perspectives and provide data that makes the process work even more smoothly. This, in turn, jazzed Seman. “Eventually we could serve all donors content targeted to their preferences,” he said. “Personalization is the next step.”
CONCLUSION
Overall, the experimentation program managed by Cro Metrics has been extremely profitable for the Sierra Club. Cro Metrics was able to help the nonprofit increase one-time donor revenue, grow monthly recurring gift revenue, and expand the number of signed petitions for action sent to legislators. More specifically, the testing delivered sizeable returns on investment for Sierra Club: a projected annualized revenue increase of more than $2.5 million. This is money the nonprofit simply wouldn’t have gotten if not for experimenting with new approaches on their site.
Looking forward, Seman says that based on the success of their experimentation program to date, Sierra Club likely will expand its engagement with Cro Metrics to include testing in other areas of the website.
Already, the nonprofit re-upped for the rest of the year.
“We’re just scratching the surface of what’s possible,” he said. “Once you start seeing how big a tiny tweak can really be, it feels kind of limitless in terms of the opportunities to test and show that you’re adding value to a program.”